同一个 count(*) 查询 SQL,在 Navicat 中,与在 Laravel 9 中,执行时长相差过大的分析
1、参考:在 MySQL 8.0 中,查询表记录总数时,超时的分析优化。 在 Navicat 中的执行时长为:3.075秒。如图1
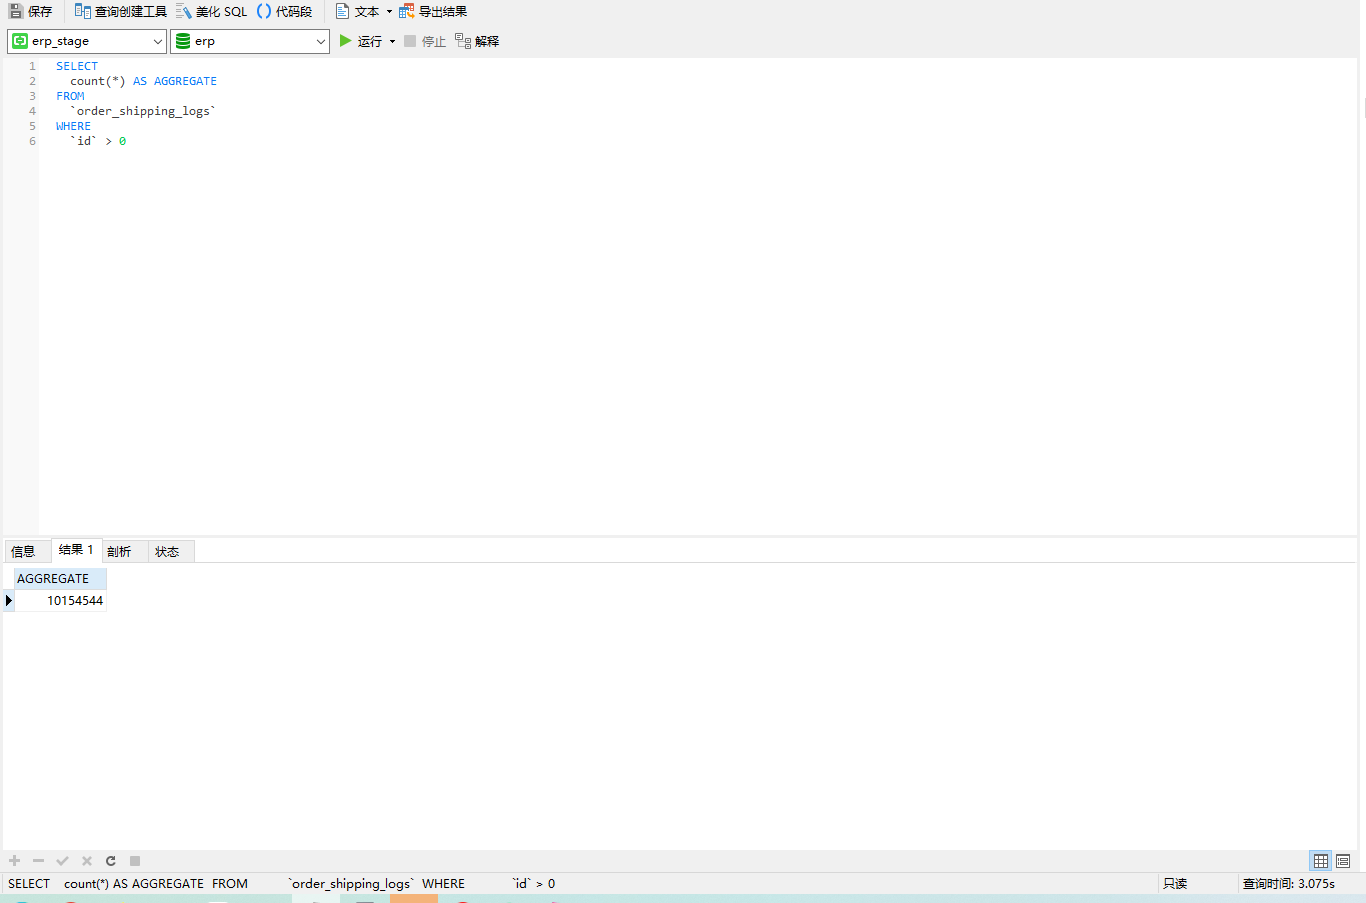
图1
1 2 3 4 5 6 | SELECT count(*) AS AGGREGATE FROM `tables` WHERE `id` > 0 |
2、在 Laravel 9 中的执行时长为:60317.74ms。其相当于 60秒。如图2
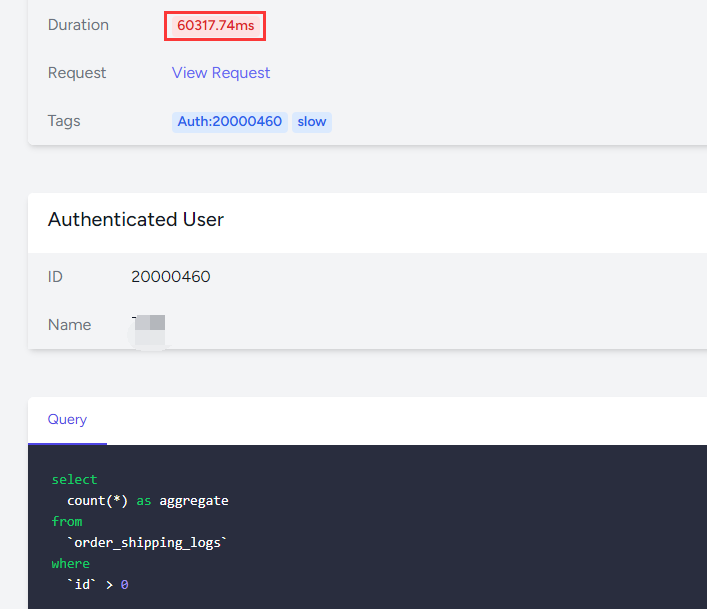
图2
3、验证另一个 count(*) SQL,在 Laravel 9 中的执行时长为:2623.17ms。其相当于 2.6秒。虽然其查询结果与上面的查询结果是相同的。但是,执行时长只有上面 SQL 的 5%。如图3
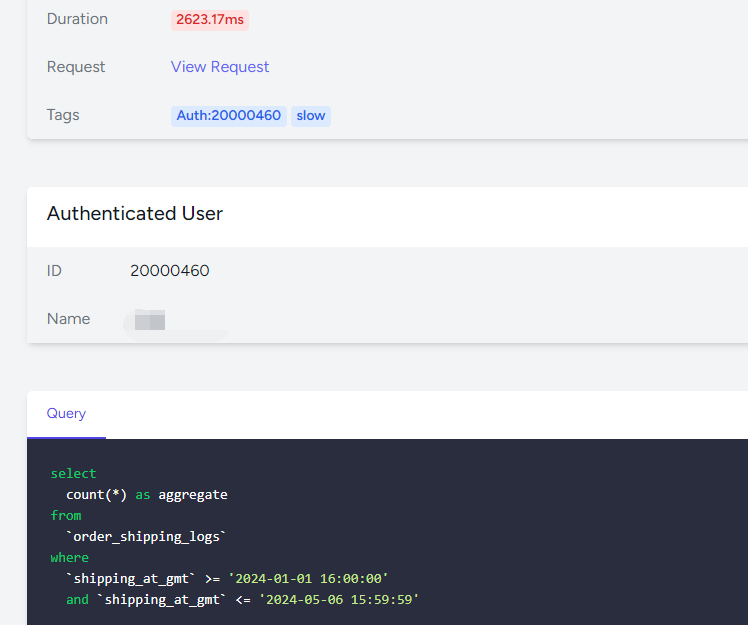
图3
1 2 3 4 5 6 7 | select count(*) as aggregatefrom `tables`where `shipping_at_gmt` >= '2024-01-01 16:00:00' and `shipping_at_gmt` <= '2024-05-06 15:59:59' |
4、在 容器 中 基于 Tinker 命令 (REPL),执行原生 SQL,时间也为 3 秒左右。如图4
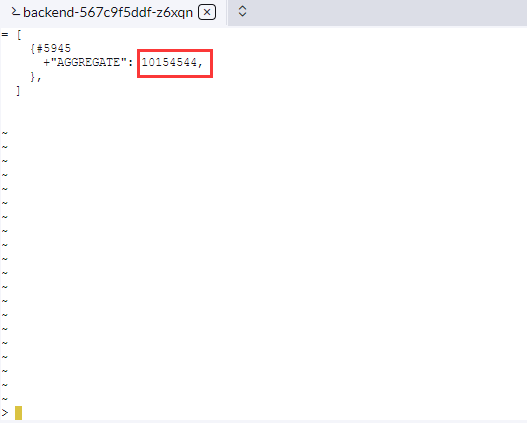
图4
1 | $count = DB::select('SELECT count(*) AS AGGREGATE FROM `tables` WHERE `id` > 0'); |
5、在 程序中执行原生 SQL,时长为 3 秒左右。如图5

图5
1 2 3 | $count = \Illuminate\Support\Facades\DB::select('SELECT count(*) AS AGGREGATE FROM `tables` WHERE `id` > 0');print_r($count);exit; |
6、最终确认,在 vendor/laravel/framework/src/Illuminate/Database/Query/Builder.php ,方法 runPaginationCountQuery 执行了 60 秒。这是框架底层的实现,暂不好解决。决定使用 where `shipping_type` in (1, 2)。SQL 执行时长为 3 秒左右,符合预期。以下为打印的日志,以确认 方法 runPaginationCountQuery 执行时间。其中 runPaginationCountQuery2 与 $results2 之间的时间,为 如下代码的执行时间。如图6、图7
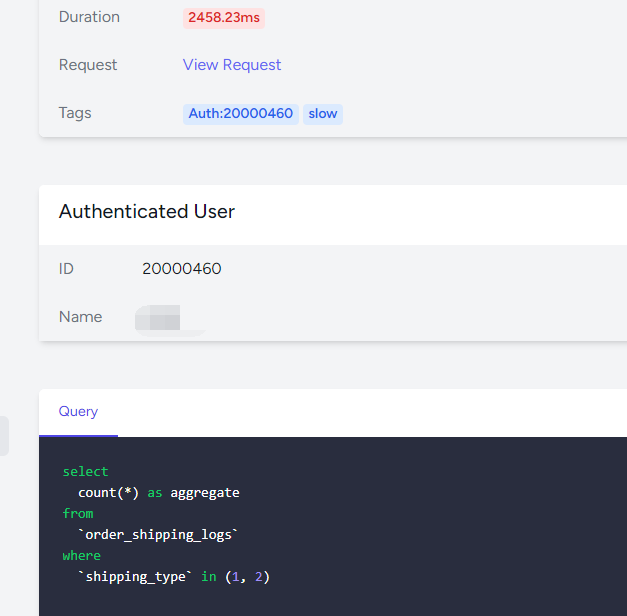
图6
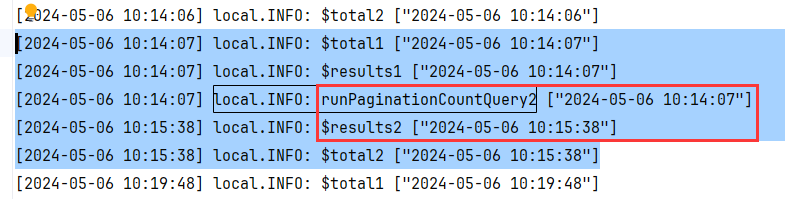
图7
1 2 3 4 | return $this->cloneWithout($without) ->cloneWithoutBindings($this->unions ? ['order'] : ['select', 'order']) ->setAggregate('count', $this->withoutSelectAliases($columns)) ->get()->all(); |
1 2 3 4 5 | [2024-05-06 10:14:07] local.INFO: $total1 ["2024-05-06 10:14:07"] [2024-05-06 10:14:07] local.INFO: $results1 ["2024-05-06 10:14:07"] [2024-05-06 10:14:07] local.INFO: runPaginationCountQuery2 ["2024-05-06 10:14:07"] [2024-05-06 10:15:38] local.INFO: $results2 ["2024-05-06 10:15:38"] [2024-05-06 10:15:38] local.INFO: $total2 ["2024-05-06 10:15:38"] |
近期评论